As the final major exercise for this course, this activity served to demonstrate the process of surveying an area utilizing industrial grade survey equipment. Utilizing a Dual Frequency Survey Grade GPS, soil-based thermometer, pH indicator, and a TDR probe, students collected data on a community garden located in Eau Claire, Wisconsin. In addition, a survey grade UAS drone was utilized to collect surface imaging which was later processed in conjunction with the collected soil survey data.
Study Area
The study area for this assignment was a community garden located in Eau Claire, Wisconsin (Figure 1). Coincidentally, the instructor was utilizing a plot in this garden to grow garlic. Due to the temperamental nature of some plant species, it is vital to know the soil characteristics in order for the desired crop to grow properly. Every plant has its own little preferences for soil pH, moisture content, and temperature. By knowing the soil characteristics, a plot can be altered to better fit the growing conditions of a desired crop.
Figure 1: A google map view of the community garden, located in Eau Claire, Wisconsin, which was surveyed for soil characteristics on April 26, 2017
Methods
First, a series of locations were marked throughout the site with flags. Then, utilizing a Dual Frequency Survey Grade GPS, location data was taken for each of these flagged points (Figure 2).
 |
| Figure 2: A surveyor collecting data on soil points in the community garden utilizing the Dual Frequency Survey Grade GPS. |
 |
Figure 3: A surveyor collecting soil
temperature data utilizing a soil
thermometer. Temperature was
collected in degrees Celsius.
|
 |
| Figure 4: A surveyor utillizng a special probe to record the pH of a soil sample by mixed it with diluted water. |
At a later date, My 3, 2017, the class returned to the site to conduct a surface mapping utilizing a survey grade unmanned aerial drone (Figure 6). This drone would collect surface data of the site in
 |
| Figure 7: A ground control point used to program the flight path of the UAS drone. |
 |
| Figure 6: The industrial grade survey drone utilized to collect surface imagery of the community garden siteand the surrounding area. |
Results
First, the UAS drone data was processed in Pix4D to create a a mosaic image and DSM elevation raster of the area surrounding the community garden (Figure 8, 9).
 |
Figure 8: A mosaic image map of the
community garden site created from the
collected drone data and processed in Pix4D.
|
 |
Figure 9: A DSM map of the community
garden site and the surrounding area displaying
the elevation of the site. This raster image was
generated by processing the collected drone data
in Pix4D
|
The image mosaic provides accurate imaging for the site at the time of recording, as the community garden site changes frequently over the course of the year. The elevation in the area is also relatively static, as can be seen from the DSM. Elevation Does not generally exceed 270 meters. The minimum for the area is just under 267 meters, and the high of 280 meters are a result of the drone recording the tropes of trees as ground level data. Utilizing the mosaic image, a map was created showing the location of each recorded point in the community garden (Figure 10). Due to time constraints, much
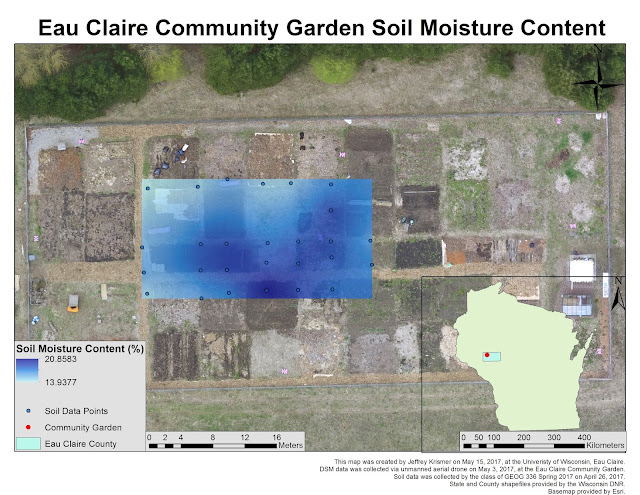
of the garden remained unfortunately unmapped. However, this point data was utilized to generate a series of surface models mapping the soil temperature, pH, moisture content, and elevation of the recorded area using a kriging interpolation method.
 |
Figure 10: A map showing the points where soil data was taken in the community garden
on April 26, 2017, in Eau Claire, Wisconsin. The entire garden could not be surveyed due to
time constraints.
|
 |
| Figure 11: An elevation map of the surveyed area of the Eau Claire community garden. The surface model was generated using a kriging spatial analyst interpolation method. |
 |
| Figure 12: A surface map showing the soil temperature of the surveyed area of the Eau Claire community garden. This model was generated utilizing the point data and the kriging interpolation method. |
Based on the data, temperature and elevation have the least variation and are likely a factor of environmental conditions while pH and soil moisture content are a result of human interaction in the fields, adding compounds or tilling the plots. While this data shows general trends of the Eau Claire community garden, it does not map the entire site. However, generating data trends was not the main focus of this exercise. This survey was designed to familiarize students with survey grade GPS systems capable of plotting a point with only centimeters of error. This has been far more accurate than any other system previously utilized in this course, and would likely be used by a student after they became employed after college.


No comments:
Post a Comment